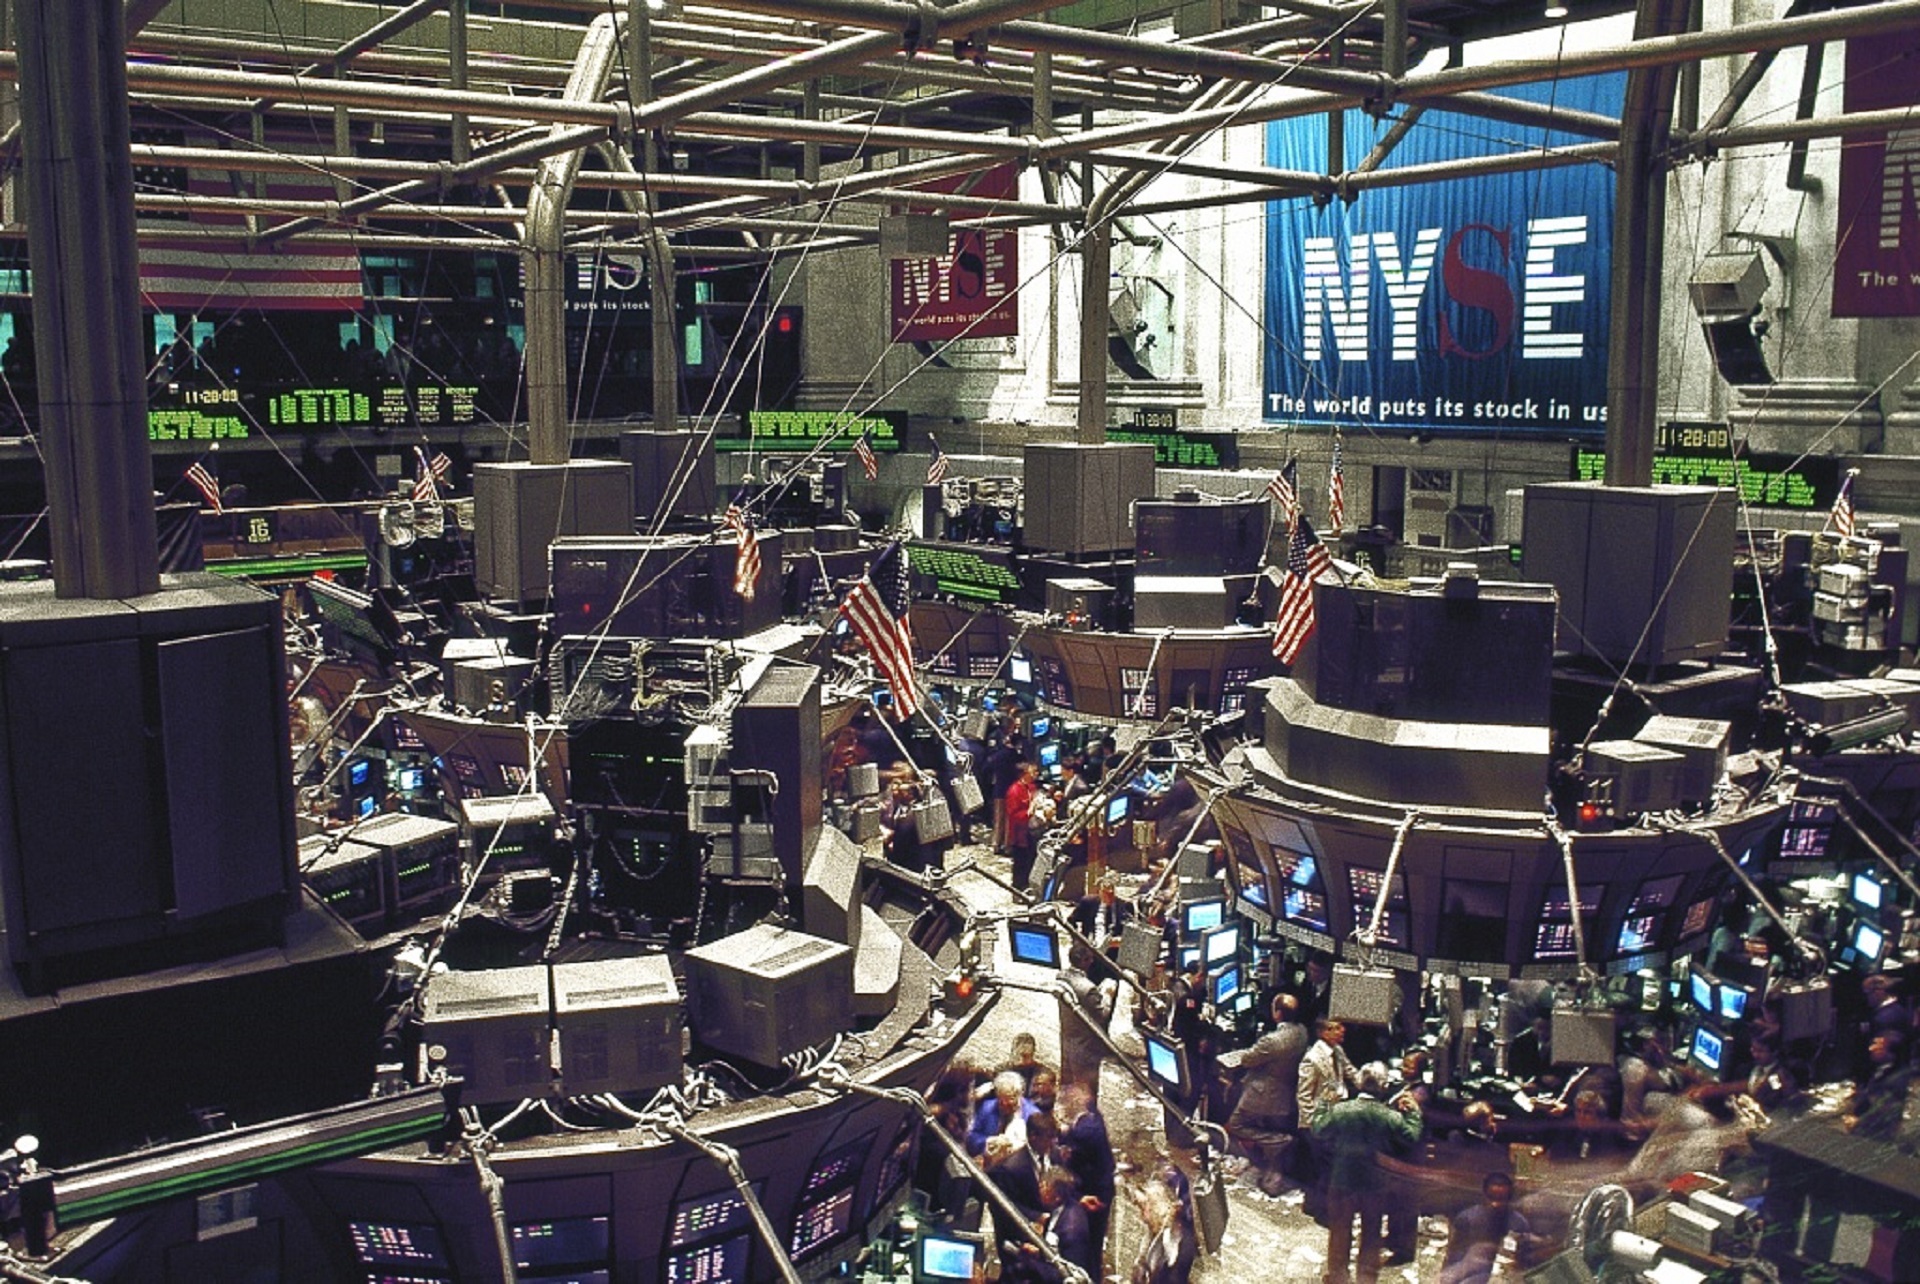
The first stock in 1957 to list on the New York Stock Exchange was a state-of-the-art, white hot company that sold beautifully designed calculators the size of a small piece of carry-on luggage. In less than two years, that company, called Marchant Calculators, was gobbled up by the typewriter behemoth Smith Corona. And, as we all know, both of those industries were destined to evolve into extinction.
However, the other invention that went live in 1957 was the S&P 500 (S&P), and it is alive and kicking to this day. It was designed to be a better mousetrap than the Dow Jones Industrials Average (DJIA) for a number of reasons, not least because it represented over 90% of the market value of the US equity market had far more names than the DJIA, which only has 30 names. In fact, while the S&P index has been around since 1926, it had only 90 constituents until its reinvention in 1957.
Flash forward to today’s S&P 500: it is standing within 1% of its all time high. There have been only 11 days so far this year that the index has lost more than half a percentage point—that compares to 34 days during the same time period for 2016. And while the S&P shed over 1% during 19 days in 2016 through late August, it only did that 3 times this year so far.
Investors are justifiably concerned about a pullback in stocks, given the level of complacency in the stock markets. The last time the S&P 500 saw a 10% correction was almost 18 months ago, when there was a brief period of heavy selling due to energy prices collapsing and China hitting a speed bump. And there are likely to be pockets of the equity market that are expensive and “over-owned”.
But that isn’t necessarily the norm. Take small-cap stocks, for instance: the index that tracks the 2000 publicly listed companies is up less than 2% this year and off 6% from its high. And in the value space, small stocks as a group are actually down nearly 4% during 2017. The energy sector has lost 16% this year and is technically in a bear market—down 20% from its high. And the S&P recently breached its 50-day moving average, a technical level that many investors focus on.
In addition, the number of stocks on the New York Stock Exchange hitting a 52-week high versus a 52-week low is now strongly in favor of the lows. Even the mighty S&P 500 is not immune to this phenomenon: there are 189 names in the index that are only 5% or less off their lows, and 96 stocks that are down over 20% from their highs—that means a fifth of the S&P 500 is in a bear market.
What many investors are potentially underestimating, though, is the impact of a small group of mega-cap names that have accounted for a large portion of this year’s rally, particularly in the technology sector. An analysis of the Nasdaq 100 shows that of the 20% return this year, just over half came from five huge companies that were big enough to budge the needle. What this means, though, is that there were a lot of other companies that didn’t make it to the party.
So the next time somebody tells you that the market is an unstoppable race car, open the hood and let them know what you see.


