


When the Music Stops: Preparing for a Bear Market

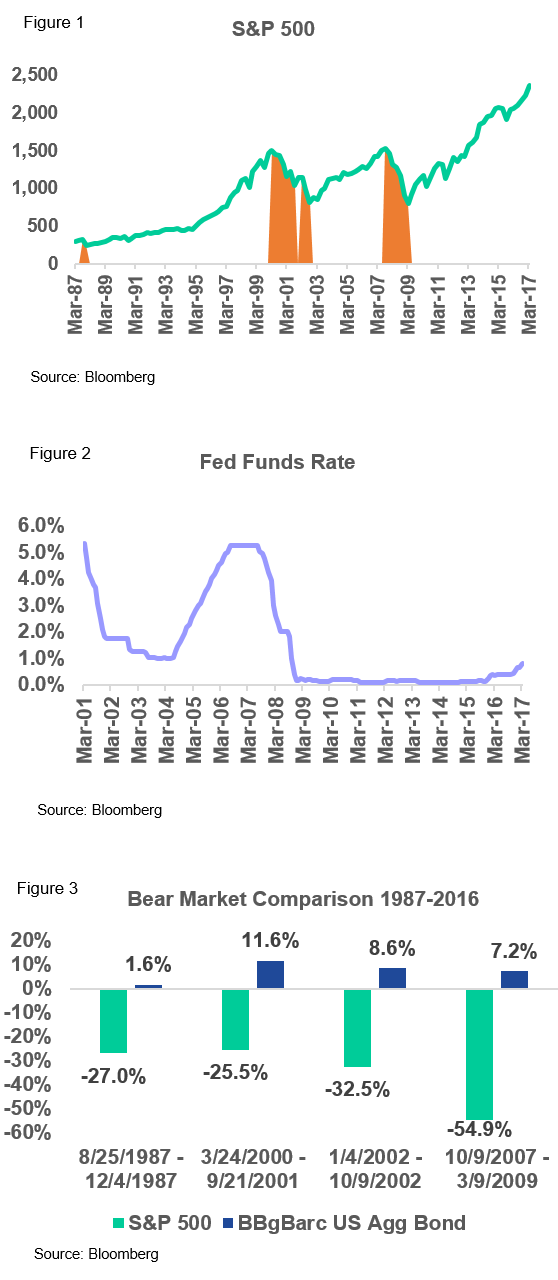
Since the market bottomed on March 9, 2009, in the depths of the financial crisis, U.S. equity markets have enjoyed a sustained bull run. Aided by intervention from global central banks and a stabilization of the global financial system, the S&P 500, since then, has generated an annualized return of 19.1% or more than 310% on a cumulative basis through the end of Q1 2017. See Figure 1.
Despite the uncertainty about potential Trump administration policy changes, the market rally continued as U.S. stocks enjoyed a winning streak of 110 consecutive trading days of not losing more than 1% in a single day – a historical outlier. The S&P 500 hasn’t experienced a win streak of this magnitude since November 2006 and has only experienced win streaks greater than 100 days 12 times since 19501. This streak may lead some investors to question why they should own anything outside of equities in their portfolios. However, all good times come to an end. Few investors, if any, are able to predict when a bear market may begin. We believe attempting to time the market is a futile exercise. Instead, we believe diversification makes far more sense. This includes owning a prudent allocation to fixed income, which has historically provided ample downside protection during adverse equity market environments.
Take March 2007, for example. The federal fund rate had steadily ticked up from June 2004 through March of 2006 from 1% to 5% as shown in Figure 2. Then the Fed held steady for a year. Equities rallied and investors were faced with a similar decision as today: what else should I own outside of equities? Well, if an investor held only equities, the financial crisis was a far bumpier ride as the difference in returns between bonds and equities exceeded 60%.
Over the past 30 years, equity markets have experienced four bear markets, as defined by declines of more than 20% in value. During that first market downturn, equities fell by 27.0%, while bonds held firm, generating approximately 1.6% in positive performance. Bonds added further downside protection in the early 2000s and more recently during the financial crisis when equities fell by 54.9% while bonds were able to offer investors a safe haven, returning over 7.2% during the same time period. See Figure 3.
It is our belief that markets are impossible to time and that the best approach to investing is formulating an integrated asset allocation strategy that gives investors the best opportunity to generate positive returns over the long-term through bull and bear markets. While past market performance is not indicative of future results, we are confident that by consistently holding a broadly diversified portfolio comprising various asset classes, investors will be far better off the next time the music stops playing.
Disclosures
Index Proxies Utilized: Cash – Citigroup 90 Day T-Bill; TIPS – Barclays US Treasury TIPS; Aggregate Bond – Barclays US Aggregate Bond Index; Municipal Bond – Barclays Municipal 5-Year Bond, High Yield – Barclays US Corporate High Yield; Foreign Bond – Barclays Global Aggregate Ex USD; Local Currency Denominated Emerging Markets Debt – JPMorgan GBI-EM Global Diversified Unhedged Index; Large Value – Russell 1000 Value; Large Blend – S&P 500; Large Growth – Russell 1000 Growth; Small Value – Russell 2000 Value; Small Blend – Russell 2000; Small Growth – Russell 2000 Growth; International – MSCI EAFE; Emerging Markets – MSCI EM; REITs – FTSE NAREIT Equity REITs; Commodities – Bloomberg Commodity Index; MLP – Alerian MLP; Hedge Funds – HFRI Fund of Funds Composite Index; Balanced – 5% Barclays US Treasury TIPS, 10% Barclays US Aggregate Bond Index, 4.5% Barclays Global Aggregate Ex USD, 4.5% Barclays Global Aggregate Ex USD (Hedged), 9% Barclays US Corporate High Yield, 2% JPMorgan GBI-EM Global Diversified Unhedged Index , 16% S&P 500, 5% Russell 2000, 12% MSCI EAFE, 7% MSCI EM, 5% FTSE NAREIT Equity REITs, 5% Bloomberg Commodity Index, 5% Alerian MLP, 10% HFRI Fund of Funds Composite Index; Domestic Equity Indices – Russell 1000, Russell 1000 Growth, Russell 1000 Value, Russell Mid-Cap, Russell Mid Cap Growth, Russell Mid-Cap Value, Russell 2000, Russell 2000 Growth, Russell 2000 Value; International Developed Markets – MSCI EAFE; US Dollar – US Dollar Index; Unhedged Developed Fixed Income – Barclays Global Aggregate Ex USD (Hedged); Real Assets – Bloomberg Commodity Index; Materials, Financials, Energy, Oil & Gas, Healthcare, Information Technology, Consumer Related Sectors – Dow Jones Sector Indices; Small Cap Securities – Russell 2000, Russell 2000 Growth, Russell 2000 Value; Large Cap Securities – Russell 1000, Russell 1000 Growth, Russell 1000 Value; Mid Cap Securities – Russell Mid Cap, Russell Mid Cap Growth, Russell Mid Cap Value; Growth; Russell 1000 Growth, Russell Mid Cap Growth, Russell Small Cap Growth; Value – Russell 1000 Value, Russell Mid Cap Value, Russell 2000 Value; Fixed Income Markets –Barclays US Treasury TIPS, Barclays Municipal 5-Year Bond, Barclays Aggregate; Investment Grade Corporate Securities – Barclays US Credit; Long Maturity Treasuries – Barclays US Treasury 20+ Year; Shorter Dated Issues – Barclays US Treasury 1-3 Year; Industrial- , Financial- and Utility-Related Credits – Barclays Fixed Income Sector Indices; BB-Rated, B-Rated and CCC-Rated – Barclays Fixed Income Credit Quality Indices; MBS – Barclays US MBS; ABS – Barclays ABS; Crude Oil – Bloomberg Composite Crude Oil; Australia, New Zealand, Japan, China, India, Taiwan, South Korea, Brazil, Mexico, Chile, South Africa, Turkey, Egypt, Hungary, Poland, Russia, Canada, United Kingdom, Spain, Germany, Italy, France – MSCI Country Index Gross return USD; Natural Gas – Bloomberg Natural Gas
Note: This report is intended for the exclusive use of clients or prospective clients of New England Investment & Retirement Group, INC. Content is privileged and confidential. Any dissemination or distribution is strictly prohibited. Information has been obtained from a variety of sources believed to be reliable though not independently verified. Any forecast represent median expectations and actual returns, volatilities and correlations will differ from forecasts. Past performance does not indicate future performance.
NEIRG is an investment adviser. Registration does not imply a certain level of skill or training. All information contained herein is believed to be correct but accuracy cannot be guaranteed. Past returns are not indicative of future results. Comments and general market-related projections are based on information available at the time of writing, are for informational purposes only, are subject to change without notice, and may not be relied upon for individual investing purposes. NEIRG and its employees do not provide tax or legal advice. NEIRG maintains the necessary notice filings, registrations, and licenses with all appropriate jurisdictions.